Background
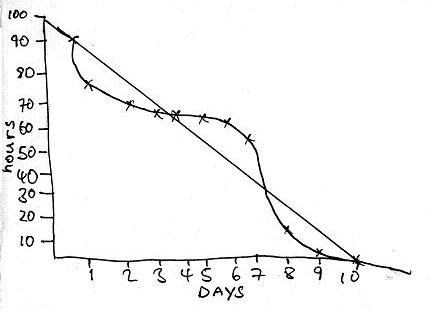
A burn down chart helps the scrum team to monitor progress in a project. The vertical axis shows work remaining and the horizontal axis shows time remaining. A line tracks the team’s progress and should reach zero by the end of the period being monitored. The most common forms of burn-down are sprint and release burn-downs.
(NOTE: Struggling to understand the basics of scrum quickly? Get the Power of Scrum Audio Book. You can use it to get a complete overview and foundation in scrum fast, before even having to “roll-out” a single scrum practice to your team. Check it out here.)
Reasons
1. Shows progress to all: Whether technical or stakeholder, this chart shows people the status of the project or sprint.
2. Simple for all to understand: Since there is nothing but a cross or dot to indicate the amount of work remaining at a given time, there is no margin for confusion.
3. Quick to update: Updating the chart by hand simply involves an update in terms of a cross or dot on the chart.
4. Draws attention to issues: An off-track burn-down chart is usually related to an impediment of some sort. It can form the basis of questions to the team so that impediments can be solved.
5. Motivates team based on status: An off-track burn-down motivates the team to highlight impediments and up the ante. An on-track burn-down motivates the team to keep doing what they are doing since all is well.
(NOTE: Struggling to understand the basics of scrum quickly? Get the Power of Scrum Audio Book. You can use it to get a complete overview and foundation in scrum fast, before even having to “roll-out” a single scrum practice to your team. Check it out here.)


